- Introduction
- Why Tracking Website Traffic Matters
- Setting Up Google Analytics
- Getting Started with Google Analytics 4
- Setting Up Conversion Goals
- Understanding Traffic Sources
- 1. Organic Search Traffic
- 2. Direct Traffic
- 3. Referral Traffic
- 4. Paid Traffic
- 5. Social Traffic
- Other Tools for Tracking Traffic
- Best Practices for Analysis
- 1. Check Your Analytics Regularly
- 2. Compare Year-Over-Year Data
- 3. Segment Your Data
- 4. Track the Customer Journey
- 5. Use Custom Reports
- 6. Set Up Alerts
- Frequently Asked Questions
Key Takeaways
- Website traffic tracking helps you understand visitor behavior and optimize your online strategy
- Google Analytics 4 remains the most popular free tool for tracking website visitors and their origins
- Traffic sources fall into five main categories: organic search, direct, referral, paid, and social
- Understanding where your visitors come from allows you to allocate marketing budgets more effectively
- Regular analysis of traffic data can improve conversion rates by up to 30% according to industry studies
- Set up specific goals and events to measure what matters most to your business
Introduction
In today’s digital landscape, understanding your website traffic is crucial for business success. Whether you’re running an e-commerce store, a blog, or a service-based website, knowing where your visitors come from and how they interact with your site can dramatically improve your online performance.
Many website owners neglect traffic analysis, treating their analytics dashboard as just another tool collecting dust. But the truth is, website traffic data is a goldmine of insights that can reveal opportunities, identify problems, and guide your strategic decisions.
In this comprehensive guide, we’ll explore how to track website traffic effectively and understand where your visitors are coming from.
Why Tracking Website Traffic Matters
Tracking website traffic provides you with actionable intelligence about your audience. Here’s why it’s essential:
- Measure ROI: Understand which marketing channels deliver the best return on investment
- Optimize Content: Identify which pages attract the most visitors and convert best
- Improve User Experience: Discover where visitors drop off and improve those areas
- Make Data-Driven Decisions: Replace guesswork with concrete data
- Identify Trends: Spot seasonal patterns and emerging opportunities
- Competitive Analysis: Benchmark your performance against industry standards
According to HubSpot’s 2023 marketing statistics, companies that use data analytics see conversion rate improvements of 20-30% compared to those relying on intuition alone.
Setting Up Google Analytics
Getting Started with Google Analytics 4
Google Analytics 4 (GA4) is the current standard for website tracking and it’s completely free. Here’s how to set it up:
- Go to google.com/analytics and sign in with your Google account
- Click “Start measuring” and create a new property
- Choose your industry category and business type
- Add your website URL and select your timezone
- Copy the Global Site Tag (gtag.js) code provided
- Paste this code in the <head> section of your website’s HTML before the closing tag
Setting Up Conversion Goals
Tracking visitors is only half the battle. You also need to track what those visitors do on your site. Set up conversion goals to measure meaningful actions:
- Purchase completion (for e-commerce sites)
- Form submissions (contact forms, sign-ups)
- Newsletter subscriptions
- Page views (reaching important content)
- Time on page (engagement metric)
Understanding Traffic Sources
Google Analytics categorizes your website traffic into five main sources. Understanding each helps you optimize your marketing strategy:
1. Organic Search Traffic
This includes visitors who find your website through search engines like Google, Bing, or Yahoo by searching for relevant keywords. Organic traffic is highly valuable because these visitors actively searched for what you offer.
In 2023, organic search accounted for approximately 53% of all website traffic across industries, making it the largest traffic source for most websites.
2. Direct Traffic
Direct traffic comes from visitors who type your URL directly into their browser or use bookmarks. This indicates brand awareness and loyalty. A healthy website typically has 10-20% direct traffic.
3. Referral Traffic
These are visitors who click links from other websites to reach you. High-quality referral traffic from reputable sites in your industry can significantly boost credibility and SEO performance.
4. Paid Traffic
Visitors from paid advertising campaigns (Google Ads, Facebook Ads, etc.) fall into this category. Tracking paid traffic helps you understand your cost per acquisition (CPA) and overall ad ROI.
5. Social Traffic
Visitors who click links from social media platforms (Facebook, Instagram, LinkedIn, Twitter, TikTok, etc.) are tracked as social traffic. This segment is crucial for brand awareness and community building.
Other Tools for Tracking Traffic
While Google Analytics is the market leader, several alternatives and complementary tools exist:
- Matomo: Open-source analytics with privacy-first approach and data ownership
- Clicky: Real-time analytics dashboard with user-friendly interface
- Plausible Analytics: Lightweight, GDPR-compliant, and visitor-friendly alternative
- Hotjar: Heatmaps and session recordings to see how visitors interact with your site
- Adobe Analytics: Enterprise-level solution for large organizations
- Mixpanel: Advanced event tracking for product-focused analytics
Best Practices for Analysis
1. Check Your Analytics Regularly
Set a schedule to review your analytics at least weekly to spot trends early. Most successful online marketers review their data daily during campaign periods.
2. Compare Year-Over-Year Data
Comparing current traffic to the same period last year helps you understand real growth versus seasonal fluctuations. Google Analytics makes this easy with built-in comparison features.
3. Segment Your Data
Don’t just look at aggregate numbers. Break down your data by:
- Device type (mobile, desktop, tablet)
- Geographic location
- Traffic source
- User demographics
- Behavior flow
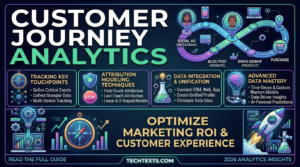
4. Track the Customer Journey
Understanding how visitors move through your website reveals optimization opportunities. If many users abandon your site at a specific page, that’s your signal to improve that page.
5. Use Custom Reports
Create custom reports in Google Analytics to focus on metrics that matter to your business. Don’t get overwhelmed by all available data—focus on KPIs (Key Performance Indicators) that align with your goals.
6. Set Up Alerts
Configure Google Analytics alerts to notify you of significant changes in traffic patterns. This helps you catch issues quickly, whether it’s a sudden traffic spike or unexpected drop.
Frequently Asked Questions
Google Analytics begins collecting data immediately after you add the tracking code to your website. However, data typically appears in your dashboard within 24 to 48 hours. Real-time reports show activity as it happens, but full historical reports take a day to populate completely.
Dark traffic occurs when visitors click links from non-tracking sources like email clients, messaging apps, or PDFs. This is not a problem—it’s normal. To reduce dark traffic, ensure you’re using proper UTM parameters in your marketing links. UTM parameters help Google Analytics identify the exact source, medium, and campaign that drove the traffic.
A good bounce rate varies by industry, but generally, anything below